Look at the graph and complete the text.
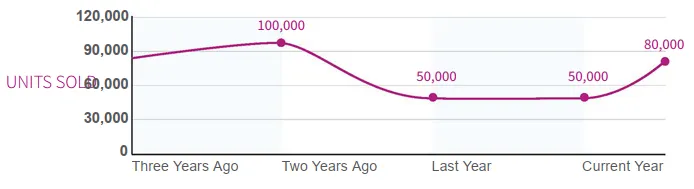
The 1 graph shows sales 2 for the last three and a half years. Three years
ago sales 3 slightly and reached 100,000 units by the end of the year. The company 4
a profit of almost £500,000 and decided to 5 the price from £8.95
to £10.25. It had an immediate effect: there was a 6 7 in sales over
the year. It was bad news, and the company made a 8 . And in the next year sales
9 the same. However, in the first two 10 of this year, they have
11 12 for the first time in many years.
|

Bình luận