| When describing the data in pie charts, use a variety of ways to describe the numbers, for example, use a mixture of percentages and fractions, to show the range of your language. Use modifiers, such as almost,just over and approximately if the figures are not exact fractions. |
|
04. Match the percentages (1-6) with the descriptions (a-f).
1. 20%
2. 77%
3. 92%
4. 31%
5. 24%
6. 48%
|
05. Write these fractions as a percentage.
1. four fifths
2. two thirds
3. a tenth
4. two fifths
5. a quarter
|
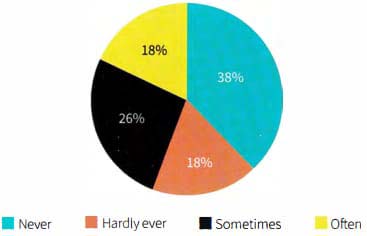
06. The pie chart shows the frequency with which adults in the US find out the news through social media. Describe each section without using the numbers. Use the modifiers in the box where appropriate.
|
|
Sample Answer
|

Bình luận